| Role | Inventory name | Hostname | Username | Password |
|---|---|---|---|---|
| Ansible Control Host | ansible | ansible-1 | student<X> | Provided by Instructor |
| IBM QRadar | qradar | qradar | admin | Ansible1! |
| Snort | snort | snort | ec2-user | No password |
| Check Point Management Server | checkpoint | checkpoint_mgmt | admin | admin123 |
| Windows Workstation | windows-ws | windows_ws | administrator | Provided by Instructor |
Note
Your Ansible Control Node includes preconfigured SSH keys to log into Red Hat Enterprise Linux hosts. Please replace student<X> with your assigned student username e.g. student1.
2.1 Investigation Enrichment
2.1.1 The Background
In the last section the focus was on single tools and how they can be automated with Ansible. In the daily operation of security practitioners the need is one step higher: when something suspicious happens and needs further attention, security operations need to deploy many tools to secure an enterprise IT. In many enterprise environments, security solutions are not integrated with each other and, in large organizations, different teams are in charge of different aspects of IT security, with no processes in common. That often leads to manual work and interaction between people of different teams which is error prone and above all, slow.
There are multiple stakeholders involved in preventing security breaches and, if a cyber attack was successful, remediate the security intrusion as quick as possible.
Let’s have a brief look at some of the personas involved.
| Persona | Tasks | Challenges |
|---|---|---|
| Chief Information Security Officer (CISO) | Manage the risk and ensure that security incidents are effectively handled. Create a security ops program. |
I have multiple teams managing security in silos. Security is not integrated into larger IT practices and landscape. |
| Security Operator | Reduce the change delivery time. Enable the escalation of potential threats. |
I receive an increasing number of requests from Governance, SOC and ITOps that I don’t have time to review and execute. |
| Security Analyst | Increase the number of events analysed and streamline the coordination of remediation processes. | Attacks are becoming more frequent, faster and complex. The tools I use don’t live up to expectations. |
We will use Ansible Automation Platform to elevate the interactions learned in the last section to combine the security tools into automated workflows.
2.1.2 Preparations
For this exercise to work properly, we’ll need to make sure a few steps in the previous Check Point exercises have been completed:
- The
whitelist_attacker.ymlplaybook must have been run at least once. - Also, the logging for the attacker whitelist policy must have been activated in the Check Point SmartConsole.
Both were done in the Check Point exercises. If you missed the steps, go back there, execute the playbook, follow the steps to activate the logging and come back here.
We will use the ibm.qradar collection and ids_rule role to modify IDS rules from the previous Snort exercise.
Next, since this is a security lab, we do need suspicious traffic - an attack. We have a playbook which simulates a simple access every five seconds on which the other components in this exercise will later on react to. In your VS Code online editor, create the playbook web_attack_simulation.yml in the user home directory with the following content:
---
- name: start attack
  hosts: attacker
  become: yes
  gather_facts: no

  tasks:
    - name: simulate attack every 5 seconds
      shell: "/sbin/daemonize /usr/bin/watch -n 5 curl -m 2 -s http://{{ hostvars['snort']['private_ip2'] }}/web_attack_simulation"
Execute the playbook:
[student@ansible-1 ~]$ ansible-navigator run web_attack_simulation.yml --mode stdout
Note
Basically in this playbook we register a small daemon running watch, which will execute a command every 5 seconds. This is a rather harsh way to start a repeating task, but serves the purpose of this lab.
The stage is set now. Read on to learn what this use case is about.
2.1.3 See the anomaly
Imagine you are a security analyst in an enterprise. You were just informed of an anomaly in an application. From within a terminal in your VS Code online editor, ssh to the snort machine.
Open a new terminal in your VS Code online editor to connect to the Snort server via SSH.
Note
As the login user for the Snort server, you need to use
ec2-user
After login, grep for the anomaly log entry:
[student@ansible-1 ~]$ ssh ec2-user@snort
Last login: Sun Sep 22 15:38:36 2019 from 35.175.178.231
[ec2-user@snort ~]$ sudo grep web_attack /var/log/httpd/access_log
172.17.78.163 - - [22/Sep/2019:15:56:49 +0000] "GET /web_attack_simulation HTTP/1.1" 200 22 "-" "curl/7.29.0"
...
You can log off from the Snort server by executing the command exit or pressing CTRL and D.
Note
You might have guessed already: this log entry is triggered every five seconds by the daemon we started at the beginning of this exercise.
As a security analyst you know that anomalies can be the sign of a breach or other serious causes. You decide to investigate. Right now, you do not have enough information about the anomaly to dismiss it as a false positive. So you need to collect more data points - like from the firewall and the IDS. Going through the logs of the firewall and IDS manually takes a lot of time. In large organizations, the security analyst might not even have the necessary access rights and needs to contact the teams responsible for both the enterprise firewall and the IDS, asking them to manually go through the respective logs and directly check for anomalies on their own and then reply with the results. This operation could take hours or even days.
2.1.4 Write playbook to create new log sources
If you use a SIEM, things are better: you can collect and analyze logs centrally. In our case the SIEM is QRadar. QRadar has the ability to collect logs from other systems and search them for suspicious activities. So how do we analyze logs in QRadar? Before we can look at these logs we need to stream them into QRadar. This happens in two steps: first we need to configure the sources - here Check Point and Snort - to forward their logs to QRadar. And second we have to add those systems as log sources to QRadar.
Doing this manually requires a lot of work on multiple machines, which again takes time and might require privileges a security analyst does not have. But Ansible allows security organizations to create pre-approved automation workflows in the form of playbooks. Those can even be maintained centrally and shared across different teams to enable security workflows at the press of a button. With these Playbooks, we as the security analyst can automatically configure both the enterprise firewall and the IDS to send their events/logs to the QRadar instance, so that we can correlate the data and decide how to proceed with the suspect application.
Note
Why don’t we add those logs to QRadar permanently? The reason is that many log systems are licensed/paid by the amount of logs they consume, making it expensive pushing non-necessary logs in there. Also, if too many logs are in there it becomes harder to analyse the data properly and in a timely manner.
So let’s write such a playbook which first configures the log sources - Snort and Check Point - to send the logs to QRadar, and afterwards add those log sources to QRadar so that it is aware of them.
As usual, the playbook needs a name and the hosts it should be executed on. Since we are working on different machines in this workflow, we will separate the playbook into different “plays”:
Note
The goal of a play is to map a group of hosts to some well defined roles, represented by things ansible calls tasks. At a basic level, a task is nothing more than a call to an ansible module.
This means that the “host” section will appear multiple times in one playbook, and each section has a dedicated task list.
Let’s start with the Snort configuration. We need Snort’s log server to send the logs to the QRadar server. This can be configured with an already existing role, ids_config, so all we have to do is to import the role and use it with the right parameters.
The security_ee custom execution environment includes the ids_config role.
So let’s create our playbook where we use the role. In your VS Code online editor, create the file enrich_log_sources.yml with the following content:
---
- name: Configure snort for external logging
  hosts: snort
  become: true
  vars:
    ids_provider: "snort"
    ids_config_provider: "snort"
    ids_config_remote_log: true
    ids_config_remote_log_destination: "{{ hostvars['qradar']['private_ip'] }}"
    ids_config_remote_log_procotol: udp
    ids_install_normalize_logs: false

  tasks:
    - name: import ids_config role
      include_role:
        name: "ansible_security.ids_config"
As you see, just like with the last time we configured Snort rules, we are re-using the role and let it do the work. We only change the behavior of the role via the parameters: we provide the QRadar IP via variable, set the IDS provider to snort and define the protocol in which packages are sent as UDP
Now we have to tell QRadar that there is this new Snort log source. Add the following play to the playbook enrich_log_sources.yml:
- name: Add Snort log source to QRadar
  hosts: qradar
  collections:
    - ibm.qradar

  tasks:
    - name: Add snort remote logging to QRadar
      qradar_log_source_management:
        name: "Snort rsyslog source - {{ hostvars['snort']['private_ip'] }}"
        type_name: "Snort Open Source IDS"
        state: present
        description: "Snort rsyslog source"
        identifier: "{{ hostvars['snort']['ansible_fqdn'] }}"
Now we have to do the same for Check Point: we need to configure Check Point to forward its logs to QRadar. This can be configured with an already existing role, log_manager. As with the ids_config role, the security_ee execution environment includes log_manager.
Now edit again the existing playbook enrich_log_sources.yml where we already brought together Snort and QRadar, and add another section for Check Point:
- name: Configure Check Point to send logs to QRadar
  hosts: checkpoint

  tasks:
    - include_role:
        name: ansible_security.log_manager
        tasks_from: forward_logs_to_syslog
      vars:
        syslog_server: "{{ hostvars['qradar']['private_ip'] }}"
        checkpoint_server_name: "YOURSERVERNAME"
        firewall_provider: checkpoint
Note that in this snippet you have to replace YOURSERVERNAME with the actual server name from your Check Point management instance, like gw-77f3f6. You can find the name of your individual Check Point instance by logging into your SmartConsole. It is shown in the GATEWAYS & SERVERS tab in the lower part of the screen underneath Summary:
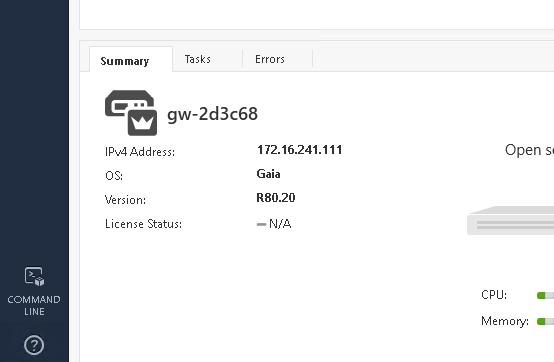
Replace the string YOURSERVERNAME in the playbook with your individual name.
Note
This could also be done automatically with two API calls, but it would complicate the playbook listing here.
Now we have to tell QRadar that there is another log source, this time Check Point. Add the following play to the playbook enrich_log_sources.yml:
- name: Add Check Point log source to QRadar
  hosts: qradar
  collections:
    - ibm.qradar

  tasks:
    - name: Add Check Point remote logging to QRadar
      qradar_log_source_management:
        name: "Check Point source - {{ hostvars['checkpoint']['private_ip'] }}"
        type_name: "Check Point FireWall-1"
        state: present
        description: "Check Point log source"
        identifier: "{{ hostvars['checkpoint']['private_ip'] }}"

    - name: deploy the new log source
      qradar_deploy:
        type: INCREMENTAL
      failed_when: false
Note that compared to the last QRadar play, this time an additional task is added: deploy the new log source. This is due to the fact that QRadar changes are spooled, and only applied upon an extra request. We ignore errors because they might happen due to timeouts in the REST API which do not inflict the actual function of the API call.
If you bring all these pieces together, the full playbook enrich_log_sources.yml is:
---
- name: Configure snort for external logging
  hosts: snort
  become: true
  vars:
    ids_provider: "snort"
    ids_config_provider: "snort"
    ids_config_remote_log: true
    ids_config_remote_log_destination: "{{ hostvars['qradar']['private_ip'] }}"
    ids_config_remote_log_procotol: udp
    ids_install_normalize_logs: false

  tasks:
    - name: import ids_config role
      include_role:
        name: "ansible_security.ids_config"

- name: Add Snort log source to QRadar
  hosts: qradar
  collections:
    - ibm.qradar

  tasks:
    - name: Add snort remote logging to QRadar
      qradar_log_source_management:
        name: "Snort rsyslog source - {{ hostvars['snort']['private_ip'] }}"
        type_name: "Snort Open Source IDS"
        state: present
        description: "Snort rsyslog source"
        identifier: "{{ hostvars['snort']['ansible_fqdn'] }}"

- name: Configure Check Point to send logs to QRadar
  hosts: checkpoint

  tasks:
    - include_role:
        name: ansible_security.log_manager
        tasks_from: forward_logs_to_syslog
      vars:
        syslog_server: "{{ hostvars['qradar']['private_ip'] }}"
        checkpoint_server_name: "YOURSERVERNAME"
        firewall_provider: checkpoint

- name: Add Check Point log source to QRadar
  hosts: qradar
  collections:
    - ibm.qradar

  tasks:
    - name: Add Check Point remote logging to QRadar
      qradar_log_source_management:
        name: "Check Point source - {{ hostvars['checkpoint']['private_ip'] }}"
        type_name: "Check Point FireWall-1"
        state: present
        description: "Check Point log source"
        identifier: "{{ hostvars['checkpoint']['private_ip'] }}"

    - name: deploy the new log sources
      qradar_deploy:
        type: INCREMENTAL
      failed_when: false
Note
Remember to replace the value
YOURSERVERNAMEwith your actual server name as mentioned further above.
2.1.5 Run playbooks to enable log forwarding
Run the full playbook to add both log sources to QRadar:
[student@ansible-1 ~]$ ansible-navigator run enrich_log_sources.yml --mode stdout
In Check Point SmartConsole you might even see a little window pop up in the bottom left corner informing you about the progress.
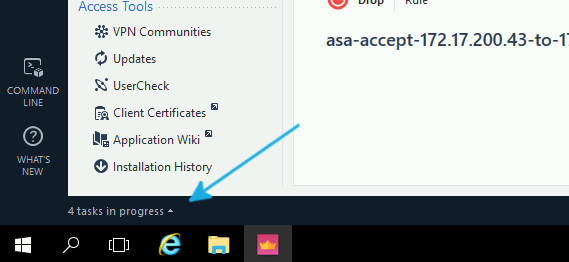
Note
If that gets stuck at 10% you can usually safely ignore it, the log exporter works anyway.
2.1.6 Verify the log source configuration
Before that Ansible playbook was invoked, QRadar wasn’t receiving any data from Snort or Check Point. Immediately after, without any further intervention by us as security analyst, Check Point logs start to appear in the QRadar log overview.
Log onto the QRadar web UI. Click on Log Activity. As you will see, there are a lot of logs coming in all the time:
IBM QRadar Credentials
Username:
adminPassword:Ansible1!
Note
It is recommended to use Mozilla Firefox with the QRadar web UI. For more information on this limitation please reference workshop issue 1536
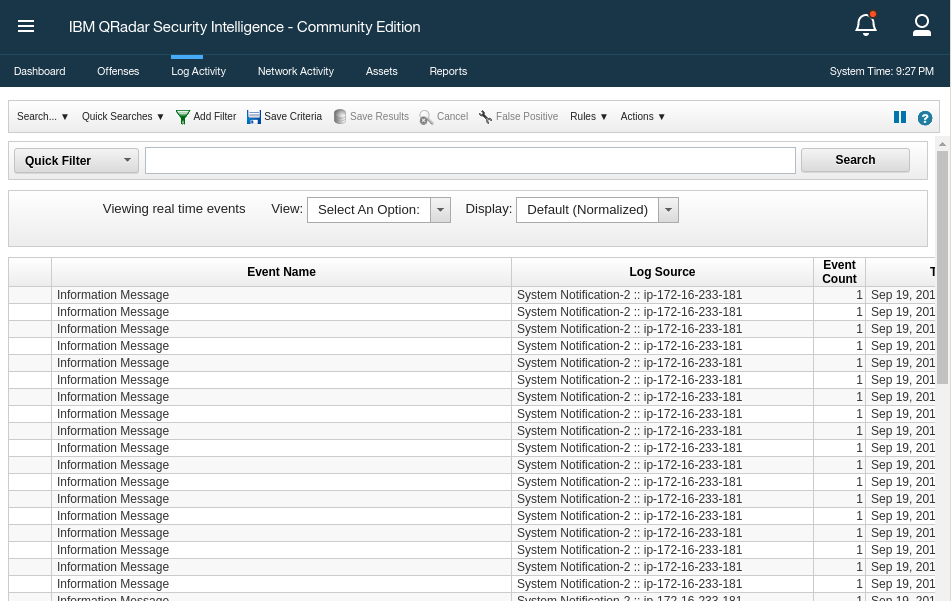
Many of those logs are in fact internal QRadar logs. To get a better overview, click on the drop down menu next to Display in the middle above the log list. Change the entry to Raw Events.
Next, in the menu bar above that, click onto the button with the green funnel symbol and the text Add Filter. As Parameter, pick Log Source [Indexed], as Operator, pick Equals any of. Then, from the list of log sources, pick Check Point source and click onto the small plus button on the right. Do the same for Snort rsyslog source, and press the button Add Filter:
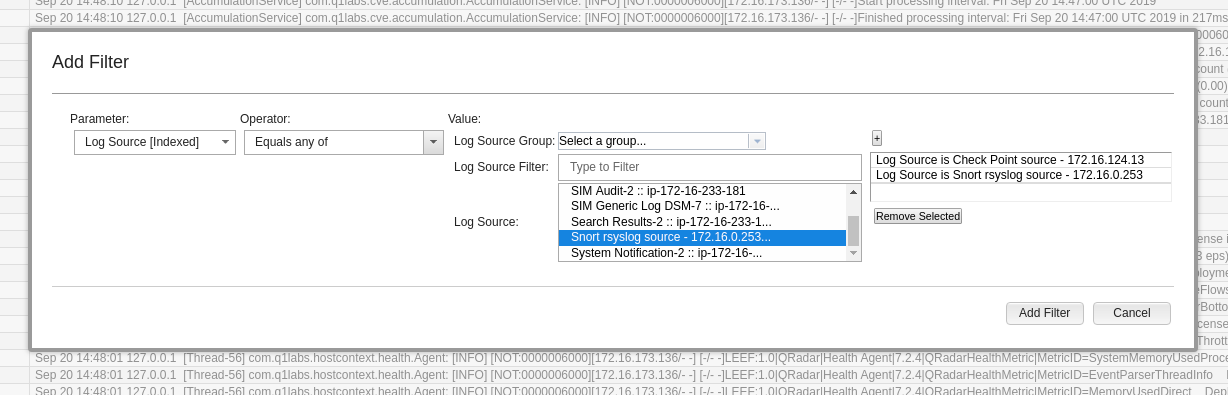
Note
We will only see Check Point logs at this point. Snort logs will only appear later in QRadar once we’ve completed a few later steps in this exercise.
Now the list of logs is better to analyze. Verify that events are making it to QRadar from Check Point. Sometimes QRadar needs a few seconds to fully apply the new log sources. Until the new log sources are fully configured, incoming logs will have a “default” log source for unknown logs, called SIM GENERIC LOG DSM-7. If you see logs from this default log source, wait a minute or two. After that waiting time, the new log source configuration is properly applied and QRadar will attribute the logs to the right log source, here Check Point.
Also, if you change the View from Real Time to for example Last 5 Minutes you can even click on individual events to see more details of the data the firewall sends you.
Let’s verify that QRadar also properly shows the log source. In the QRadar UI, click on the “hamburger button” (three horizontal bars) in the left upper corner and then click on Admin at the bottom.
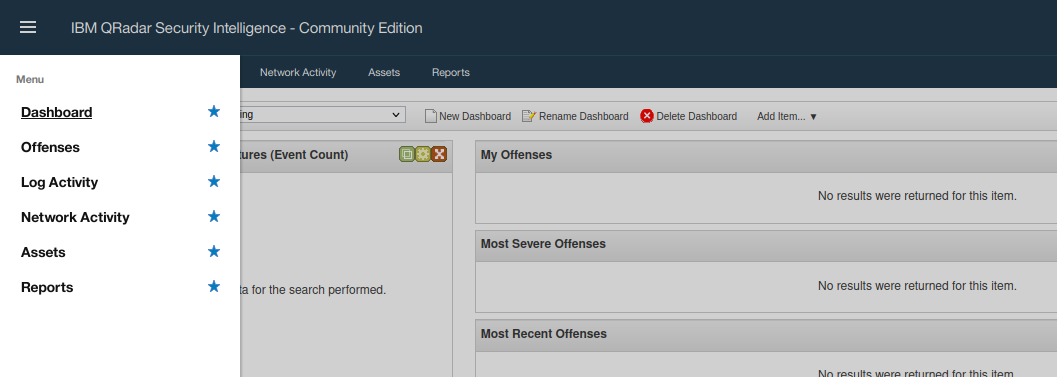
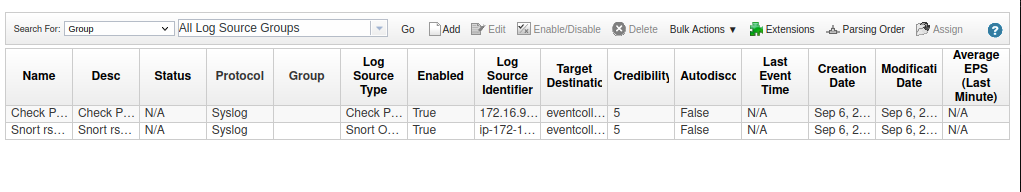
In there, click on Log Sources.
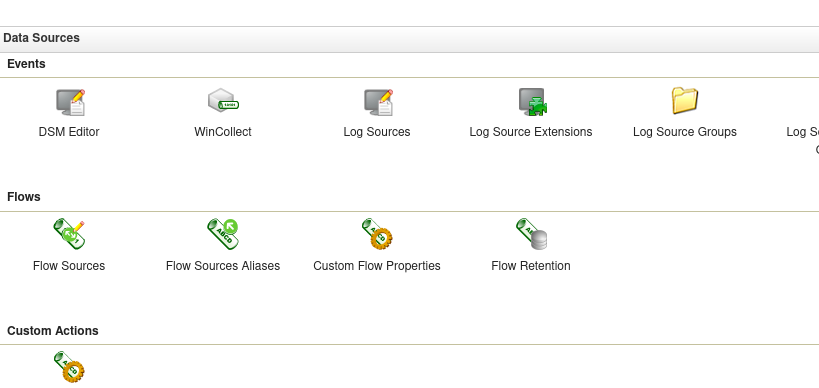
A new window opens and shows the new log sources.
In Check Point the easiest way to verify that the log source is set is indeed via command line. From the terminal of your VS Code online editor, use SSH to log into the Check Point management server IP with the user admin and issue the following ls command:
[student@ansible-1 ~]$ ssh admin@checkpoint_mgmt
[Expert@gw-77f3f6:0]# ls -l /opt/CPrt-R80/log_exporter/targets
total 0
drwxr-xr-x 6 admin root 168 Sep 16 11:23 syslog-22.33.44.55
As you can see the central log server was configured via Check Point’s internal log exporter tool. Leave the Check Point server and go back to your control host.
Let’s also verify that the Snort configuration in the background was successful. From the terminal of your VS Code online editor, log onto your Snort instance via SSH as the user ec2-user. Become root and verify the rsyslog forwarding configuration:
[student@ansible-1 ~]$ ssh ec2-user@snort
Last login: Wed Sep 11 15:45:00 2019 from 11.22.33.44
[ec2-user@snort ~] sudo cat /etc/rsyslog.d/ids_confg_snort_rsyslog.conf
$ModLoad imfile
$InputFileName /var/log/snort/merged.log
$InputFileTag ids-config-snort-alert
$InputFileStateFile stat-ids-config-snort-alert
$InputFileSeverity alert
$InputFileFacility local3
$InputRunFileMonitor
local3.* @44.55.66.77:514
Leave the Snort server again and come back to your control host.
Note that so far no logs are sent from Snort to QRadar: Snort does not know yet that this traffic is noteworthy!
But as a security analyst, with more data at our disposal, we finally have a better idea of what could be the cause of the anomaly in the application behavior. We see the logs from the firewall, see who is sending traffic to who, but there’s still not enough data to dismiss the event as a false positive.
2.1.7 Add Snort signature
To decide if this anomaly is a false positive, as a security analyst you need to exclude any potential attack. Given the data at your disposal you decide to implement a new signature on the IDS to get alert logs if such traffic is detected again.
In a typical situation, implementing a new rule would require another interaction with the security operators in charge of Snort. But luckily we can again use an Ansible Playbook to achieve the same goal in seconds rather than hours or days.
In the previous Snort exercise we already added a Snort rule with a signature to get more information, so we can reuse the playbook and only change the rule data. In your VS Code online editor, create a file called enrich_snort_rule.yml in your users’ home directory with the following content:
---
- name: Add Snort rule
  hosts: snort
  become: yes

  vars:
    ids_provider: snort
    protocol: tcp
    source_port: any
    source_ip: any
    dest_port: any
    dest_ip: any

  tasks:
    - name: Add snort web attack rule
      include_role:
        name: "ansible_security.ids_rule"
      vars:
        ids_rule: 'alert {{protocol}} {{source_ip}} {{source_port}} -> {{dest_ip}} {{dest_port}}  (msg:"Attempted Web Attack"; uricontent:"/web_attack_simulation"; classtype:web-application-attack; sid:99000020; priority:1; rev:1;)'
        ids_rules_file: '/etc/snort/rules/local.rules'
        ids_rule_state: present
In this play we provide some variables for Snort stating that we want to control any traffic on tcp. Afterwards, with the help of the ids_rule role we set a new rule containing the web_attack_simulation string as content, making it possible to identify future occurrences of this behavior.
Now execute the playbook:
[student@ansible-1 ~]$ ansible-navigator run enrich_snort_rule.yml --mode stdout
Let’s quickly verify that the new rule was indeed added. From the terminal of your VS Code online editor, ssh to the Snort server as ec2-user and have a look into the directory of custom rules:
[student@ansible-1 ~]$ ssh ec2-user@snort
Last login: Fri Sep 20 15:09:40 2019 from 54.85.79.232
[ec2-user@snort ~]$ sudo grep web_attack /etc/snort/rules/local.rules
alert tcp any any -> any any  (msg:"Attempted Web Attack"; uricontent:"/web_attack_simulation"; classtype:web-application-attack; sid:99000020; priority:1; rev:1;)
2.1.8 Identify and close the Offense
Moments after the playbook has been executed, we can check in QRadar if we see Offenses. And indeed, that is the case. Log into your QRadar UI, click on Offenses, and there on the left side on All Offenses:

With these information at our hand, we can now finally check all offenses of this type, and verify that they are all coming only from one single host, the attacker.
The next step would be to get in touch with the team responsible for that machine, and discuss the behavior. For the purpose of the demo we assume that the team of that machine provides feedback that this behavior is indeed wanted, and that the security alert is a false positive. Thus we can dismiss the QRadar offense.
In the Offense view, click on the Offense, then in the menu on top on Actions, In the drop-down menu-click on close. A window will pop up where you can enter additional information and finally close the offense as a false positive.
2.1.9 Rollback
In the final step, we will rollback all configuration changes to their pre-investigation state, reducing resource consumption and the analysis workload for us and our fellow security analysts. Also we need to stop the attack simulation.
We create a new playbook, rollback.yml, based on the enrich_log_sources.yml. The major differences are that for QRadar we set the state of the log sources to absent, for Snort we set ids_config_remote_log to false, and for Check Point we initiate the tasks for unforward_logs_to_syslog.
The playbook rollback.yml should have this content:
---
- name: Disable external logging in Snort
  hosts: snort
  become: true
  vars:
    ids_provider: "snort"
    ids_config_provider: "snort"
    ids_config_remote_log: false
    ids_config_remote_log_destination: "{{ hostvars['qradar']['private_ip'] }}"
    ids_config_remote_log_procotol: udp
    ids_install_normalize_logs: false

  tasks:
    - name: import ids_config role
      include_role:
        name: "ansible_security.ids_config"

- name: Remove Snort log source from QRadar
  hosts: qradar
  collections:
    - ibm.qradar

  tasks:
    - name: Remove snort remote logging from QRadar
      qradar_log_source_management:
        name: "Snort rsyslog source - {{ hostvars['snort']['private_ip'] }}"
        type_name: "Snort Open Source IDS"
        state: absent
        description: "Snort rsyslog source"
        identifier: "{{ hostvars['snort']['ansible_fqdn'] }}"

- name: Configure Check Point to not send logs to QRadar
  hosts: checkpoint

  tasks:
    - include_role:
        name: ansible_security.log_manager
        tasks_from: unforward_logs_to_syslog
      vars:
        syslog_server: "{{ hostvars['qradar']['private_ip'] }}"
        checkpoint_server_name: "YOURSERVERNAME"
        firewall_provider: checkpoint

- name: Remove Check Point log source from QRadar
  hosts: qradar
  collections:
    - ibm.qradar

  tasks:
    - name: Remove Check Point remote logging from QRadar
      qradar_log_source_management:
        name: "Check Point source - {{ hostvars['checkpoint']['private_ip'] }}"
        type_name: "Check Point NGFW"
        state: absent
        description: "Check Point log source"
        identifier: "{{ hostvars['checkpoint']['private_ip'] }}"

    - name: deploy the log source changes
      qradar_deploy:
        type: INCREMENTAL
      failed_when: false
Note
Again, remember to replace the value of
YOURSERVERNAMEwith the actual server name of your Check Point instance.
While this playbook is maybe the longest you see in these entire exercises, the structure and content should already be familiar to you. Take a second to go through each task to understand what is happening.
Note
Please ensure that you have exited out of any current ssh sessions and have your control-node prompt open before running the
rollback.ymlplaybook.
Run the playbook to remove the log sources:
[student@ansible-1 ~]$ ansible-navigator run rollback.yml --mode stdout
Also, we’ll need to stop the process which simulates the web attack. Let’s create a simple playbook that uses the shell module to stop the process running on the attacker machine.
We are using the shell module because it allows us to use piping. Shell piping let’s us chain multiple commands together which we need to stop the process.
Let’s create a new playbook called stop_attack_simulation.yml using the VS Code online editor and add the following content:
---
- name: stop attack simulation
  hosts: attacker
  become: yes
  gather_facts: no

  tasks:
    - name: stop attack process
      shell: >
        sleep 2;ps -ef | grep -v grep | grep -w /usr/bin/watch | awk '{print $2}'|xargs kill &>/dev/null; sleep 2
And then, run the stop_attack_simulation.yml playbook.
[student@ansible-1 ~]$ ansible-navigator run stop_attack_simulation.yml --mode stdout
You are done with the exercise. Turn back to the list of exercises to continue with the next one.
Navigation
Previous Exercise | Next Exercise
Click here to return to the Ansible for Red Hat Enterprise Linux Workshop